Get Started
Scan to Download App
iOS & Android
BitMart / Crypto / ZAMA

Zama (ZAMA)

$
$ 0.029 (ZAMA/USD)
0.00%
24H

Zama Live Price data

Today's price of Zama Is $ 0.029 (ZAMA/USD). With A Market Cap Of $ 65.96M USD. 24-Hour Trading Volume Of $ 28.61M USD, A 24-Hour Price Change Of +0.00%, And A Circulating Supply Of 2.20B ZAMA.

Zama ZAMA Price History USD

Track the price of Zama for today, 7 days, 30 days and 90 days
Period
Change
Change (%)
Today
$ 0
0.00%
7days
$ 0
0.00%
30days
$ 0
0.00%
90days
$ 0
0.00%

Own ZAMA Now

Buy and sell ZAMA easily and securely on BitMart.
Buy/Sell ZAMA Now
Buy/Sell {0} Now
Zama Market Information
Last price $ 0.029
$ 0.029 24h Range $ 0.039
All time high
‎$ 0.11‎
All time low
‎$ 0.019‎
24h Change
‎0.00%‎
24h Vol
‎$ 28,607,718.57‎
Circulating supply
2.20B ZAMA
Market cap
‎$ 65.96M‎
Max supply
--
Fully diluted market cap
‎$ 329.78M‎
Trade ZAMA

Earn

Put your idle crypto to work and earn passive income through savings, staking, and more.
Try Now
Try Now

Zama X Insight

avatar
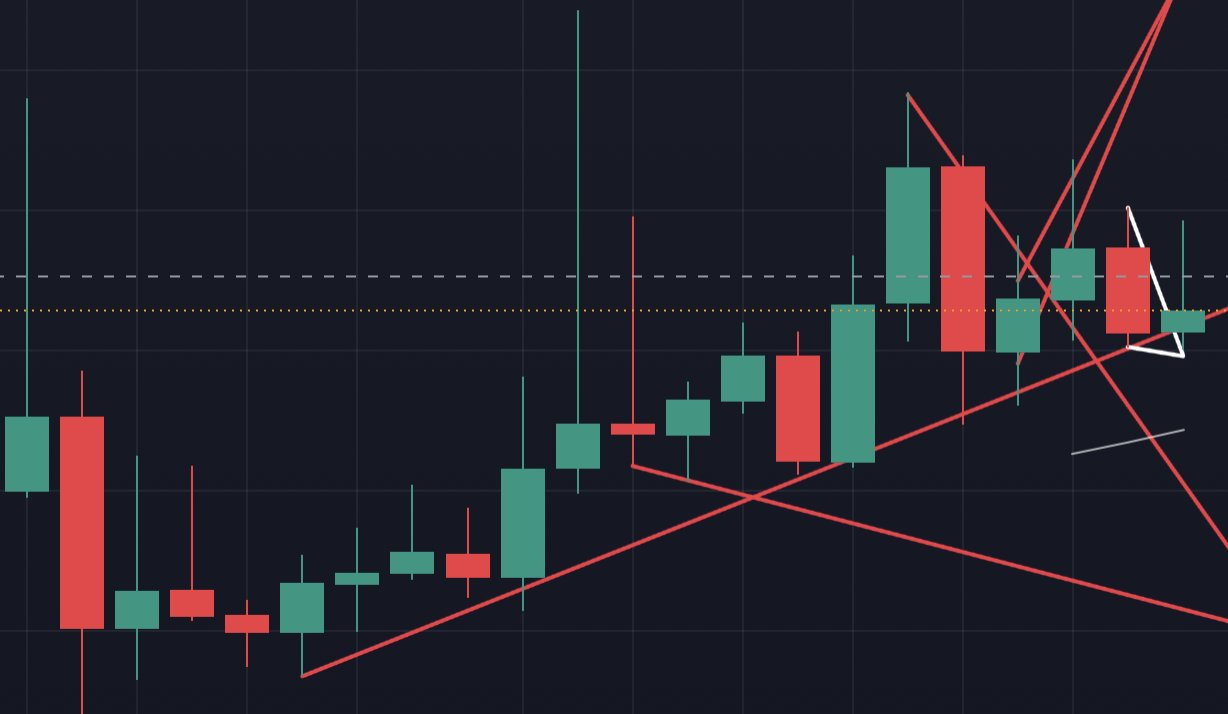
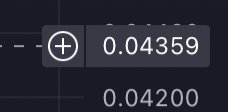
ZAMA is nearing the double‑anchor target, the author predicts the next rally target to be $0.043‑0.044.

$ZAMA update: Nice move here, double anchor target hit. Well almost. Next rally target is $0.043-44 https://t.co/IkHaOveFXF

view 2
view 0
view 271
2026-07-06 22:07
Trend of ZAMA after release
Bullish
ZAMA is nearing the double‑anchor target, the author predicts the next rally target to be $0.043‑0.044.
avatar
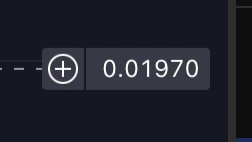
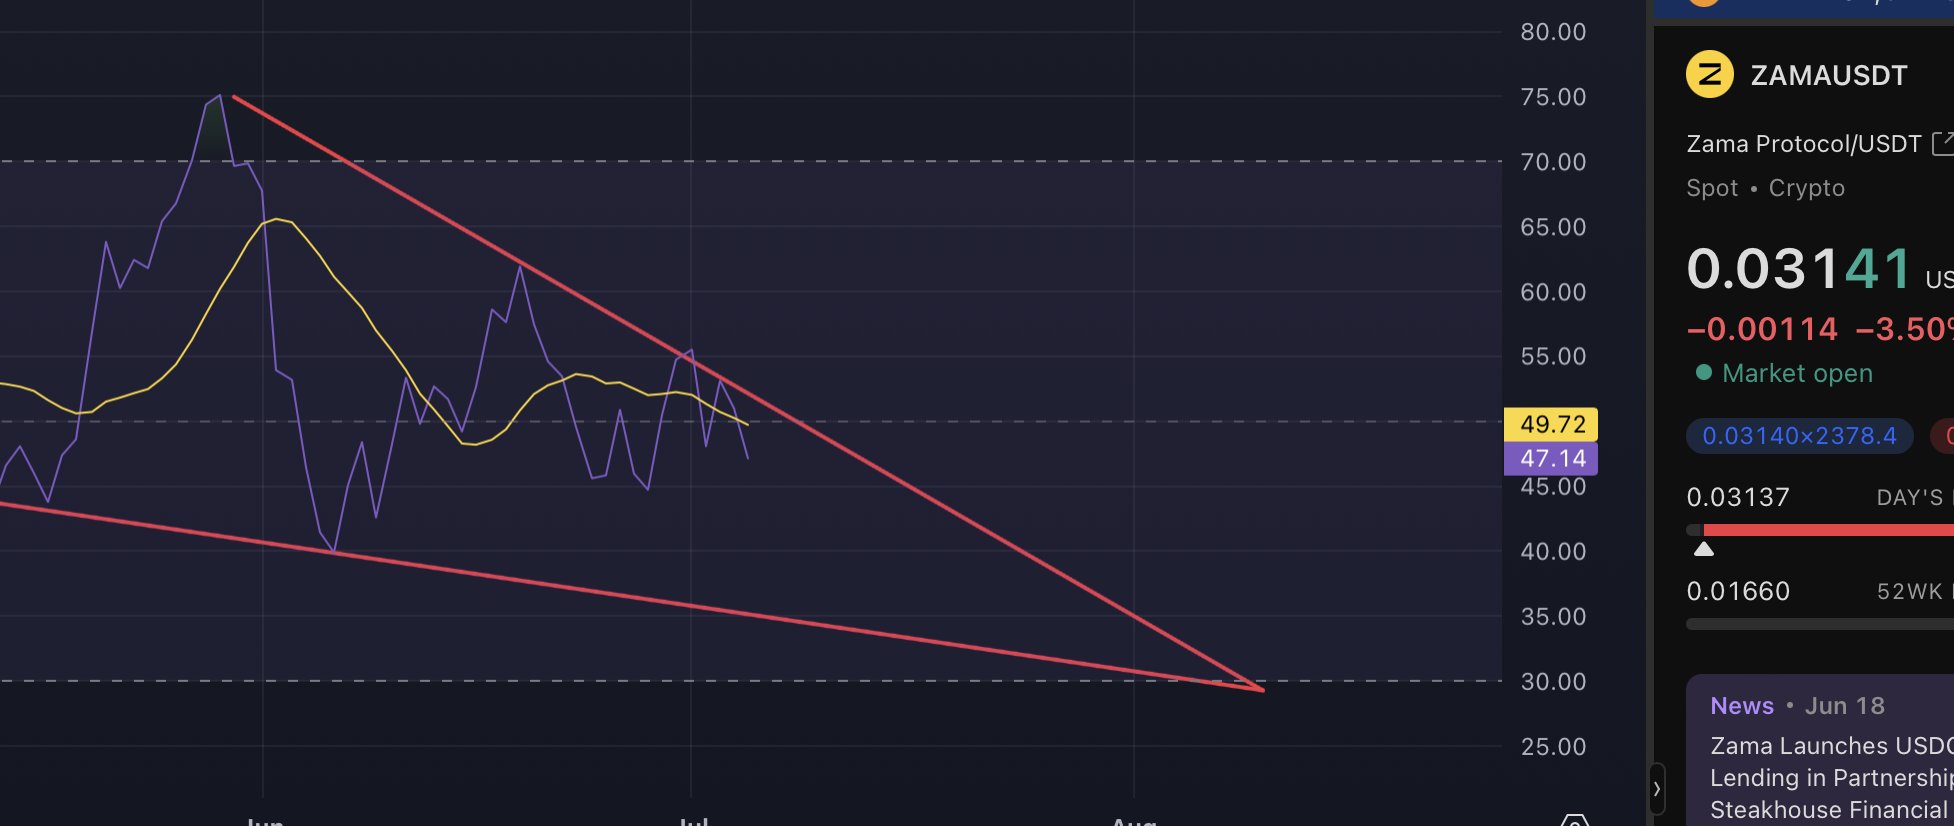
ZAMA may pull back to 0.0197 in the short term, and the author plans to buy on the dip.

$ZAMA update: Zama may give us all a chance to get in much deeper if this rolls over trend. I have a lower target but in the past, Zama likes to go right below the trend then bounce. Maybe it just need to hit 0.0297 first. I have a 0.0197 lower target if this falls apart. https://t.co/b2S7NJSiiN
view 1
view 0
view 749
2026-07-05 15:17
Trend of ZAMA after release
Bearish
ZAMA may pull back to 0.0197 in the short term, and the author plans to buy on the dip.
avatar
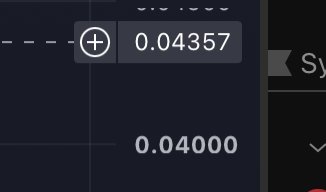
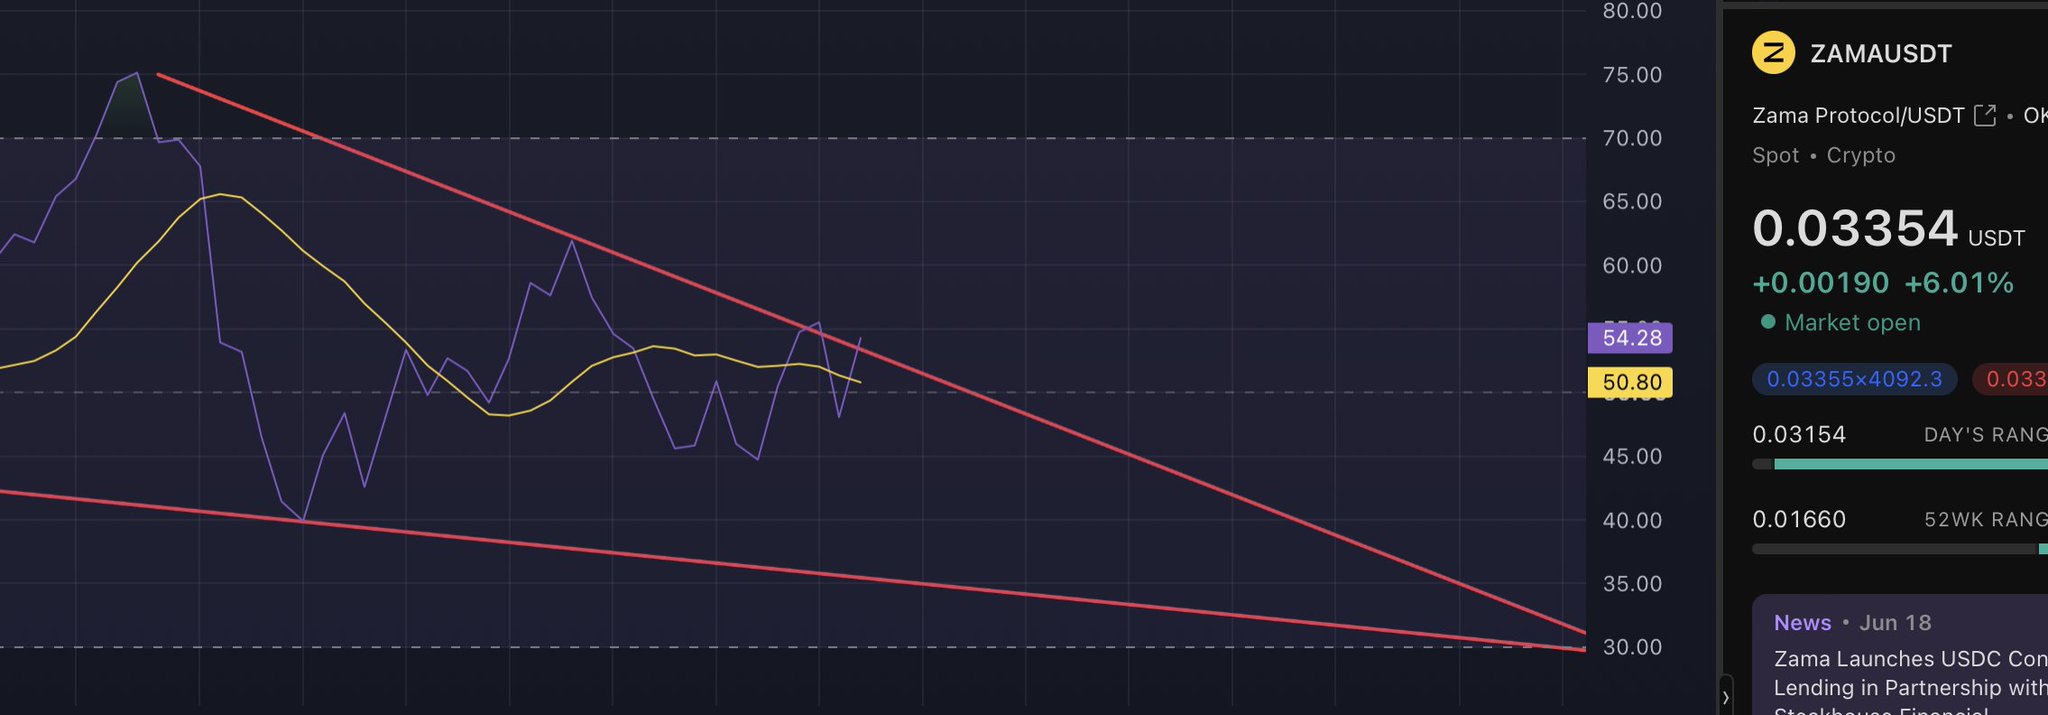
ZAMA shows a buy signal, testing resistance, target price 0.043.

$ZAMA update: Averages are strong. RSi on the daily testing that resistance again after a buy signal. If we get the push upper target is 0.043 https://t.co/DW4niMwwTL
view 0
view 0
view 554
2026-07-03 16:57
Trend of ZAMA after release
Bullish
ZAMA shows a buy signal, testing resistance, target price 0.043.
Details

Price Prediction

When is a good time to buy ZAMA? Should I buy or sell ZAMA now?

When deciding whether it’s a good time to buy or sell Zama (ZAMA), it’s important to first align with your own trading strategy and risk profile.Long-term investors and short-term traders often interpret market conditions differently, so your decision should reflect your personal approach. According to the latest ZAMA 4-hour technical analysis, the current trading signal is Hold. According to the latest ZAMA 1-day technical analysis, the current signal is Hold.
55
Hold
4-hour technical analysis of ZAMA
Last Update 2026-07-06 23:59:59
55
Hold
1-day technical analysis of ZAMA
Last Update 2026-07-06 23:59:59
beacon

Beacon Prediction

Probabilistic Price Forecast (Next 24 Hours)
i
Beacon Prediction Disclaimer
The data results displayed on this page are analyzed based on actual trading data (OHLCV) of the selected trading pair along with corresponding technical indicators.
This prediction is an experimental technical product and is provided for reference purposes only. It does not constitute investment advice. Unexpected real-world events may significantly impact market behavior. Traders should make decisions with caution.
About Zama
Zama (ZAMA) is a cryptocurrency launched in 2026and operates on the Ethereum platform. Zama has a current supply of 11,000,000,000 with 2,200,000,000 in circulation. The last known price of Zama is 0.03265734 USD and is up 1.01 over the last 24 hours. It is currently trading on 177 active market(s) with $21,378,974.38 traded over the last 24 hours. More information can be found at https://www.zama.org/.
Read More