 Bitcoin Cash (BCH)
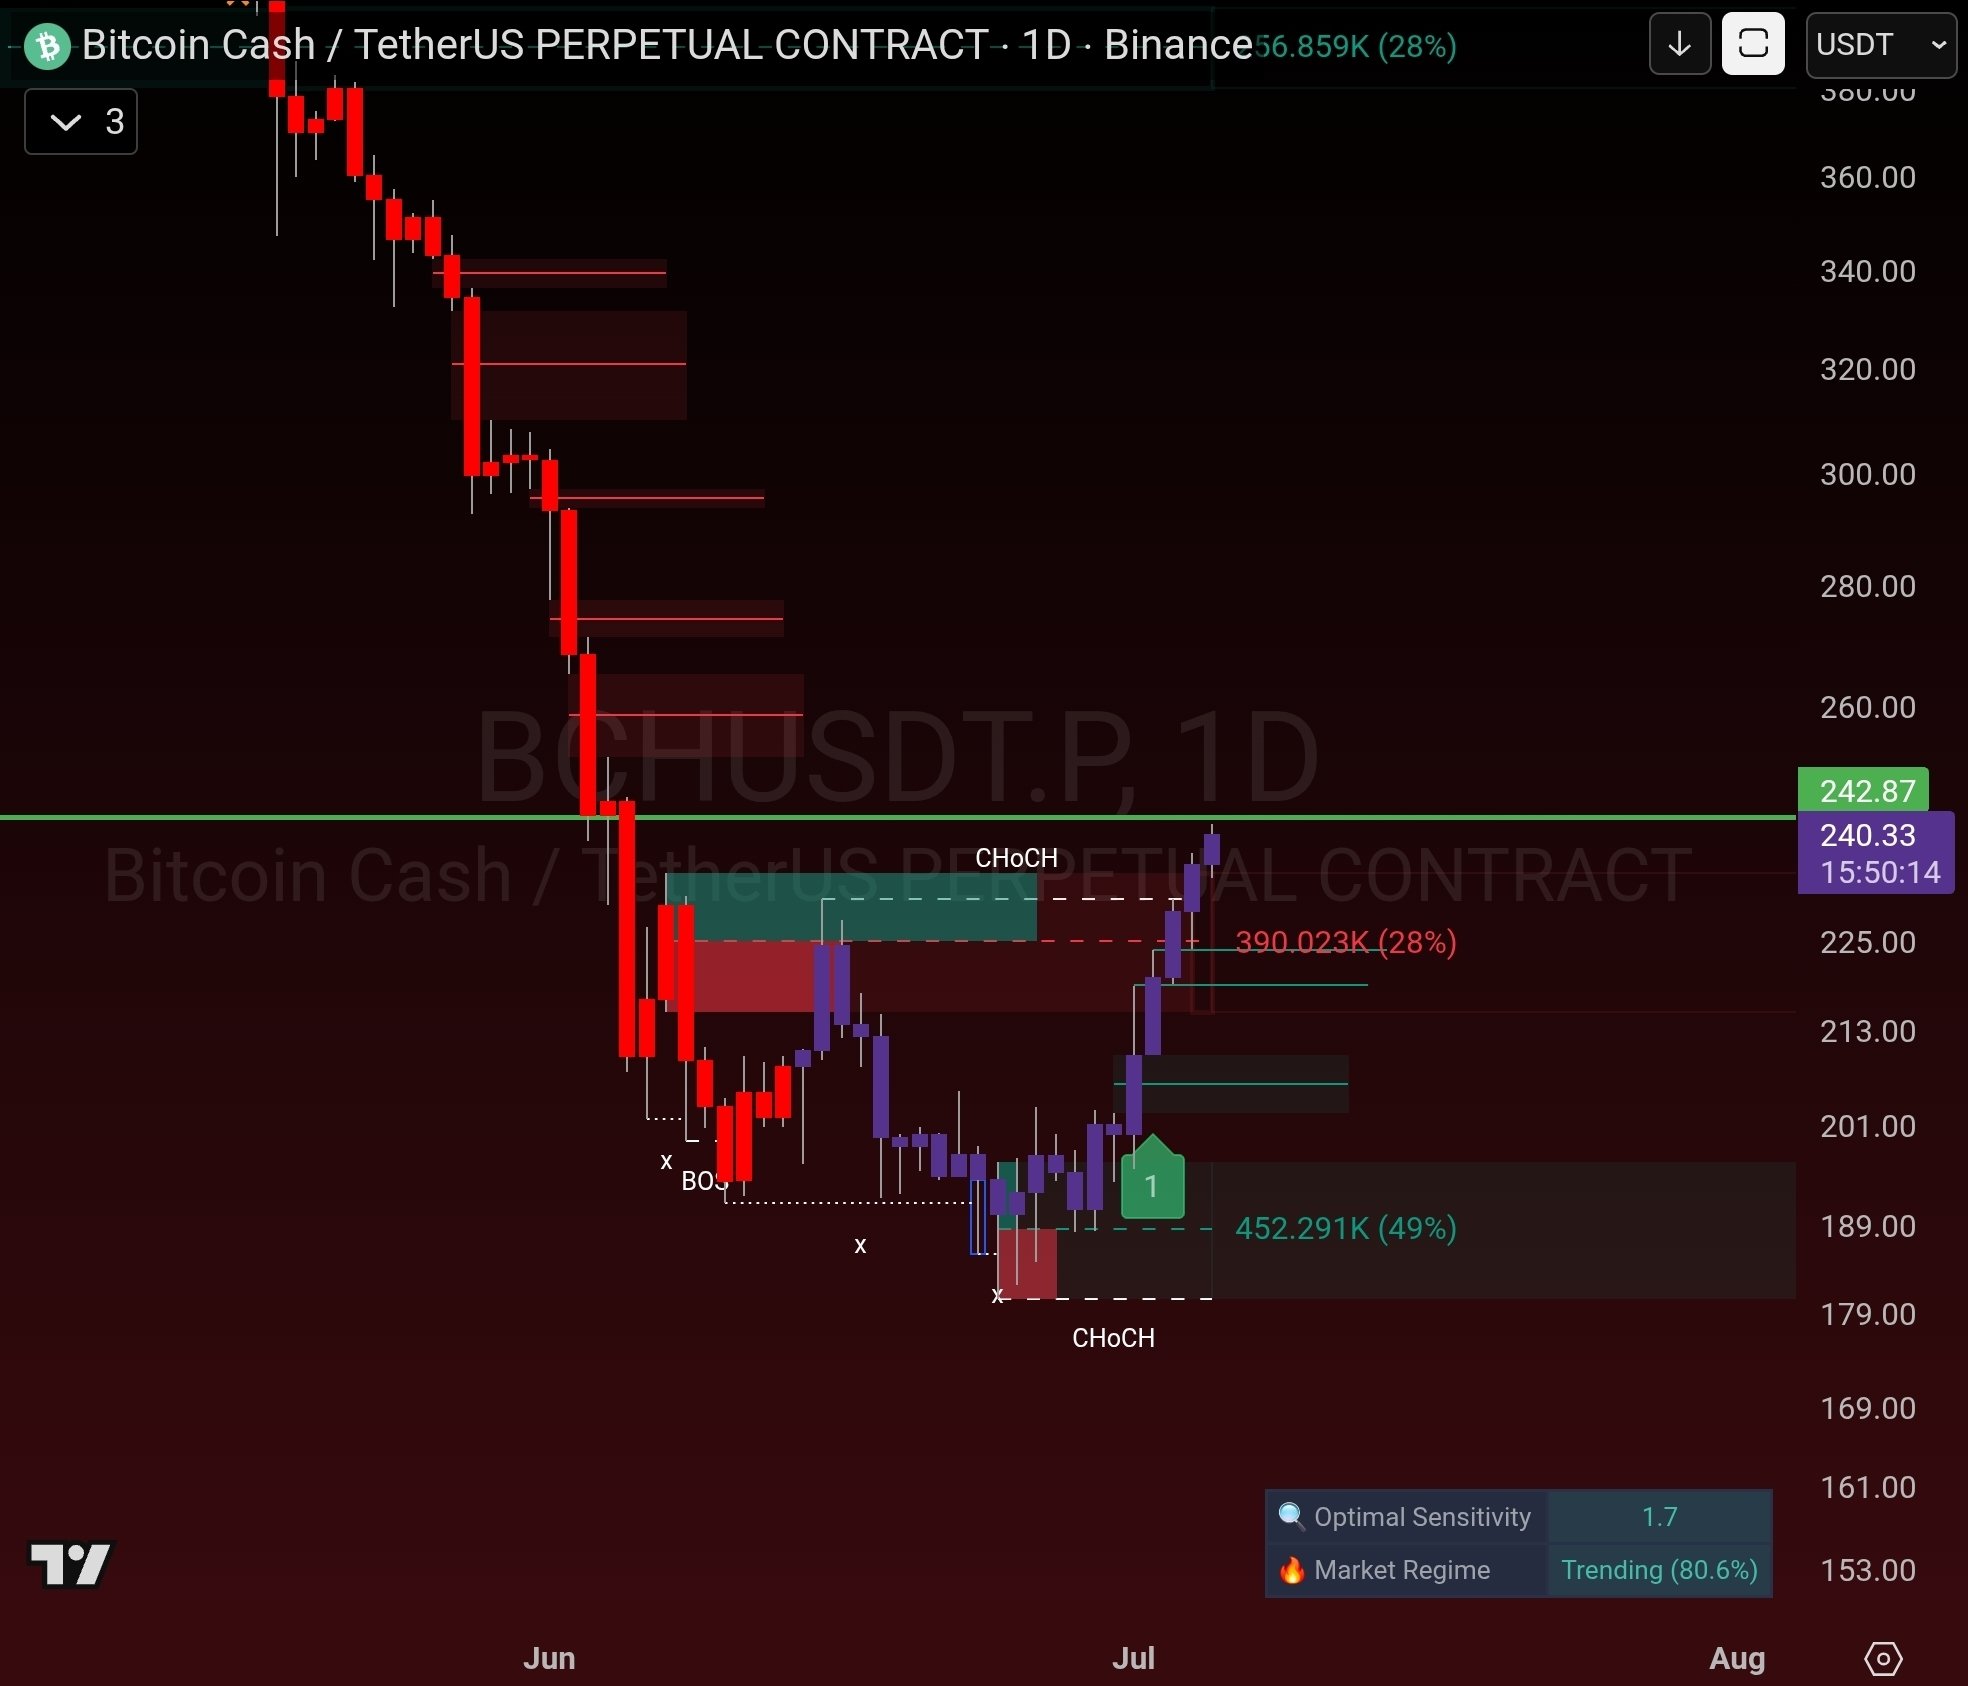
$237.52 +5.74% 24H
- 28社交熱度指數(SSI)-47.99% (24h)
- #51市場預警排名(MPR)+24
- 224小時社交提及量-33.33% (24h)
- 0%24小時KOL看好比例1位活躍KOL
- 概要
- 看漲訊號
- 看跌訊號
社交熱度指數(SSI)
- 總體資料28SSI
- 社交熱度趨勢(7D)價格(7D)情緒分佈看跌 (50%)極度看跌 (50%)社交熱度洞察
市場預警排名(MPR)
- 預警解讀
相關推文
 LSTRADER TA_Analyst Trader A37.16K @LSTraderCrypto
 LSTRADER TA_Analyst Trader A37.16K @LSTraderCrypto
 77 6 4.60K 閱讀原文 >釋出後BCH走勢看漲
- 釋出後BCH走勢極度看跌
- 釋出後BCH走勢看跌
- 釋出後BCH走勢看跌
- 釋出後BCH走勢看跌
- 釋出後BCH走勢看漲
- 釋出後BCH走勢看跌
- 釋出後BCH走勢看跌
 CW OnChain_Analyst Trader B22.77K @CW8900
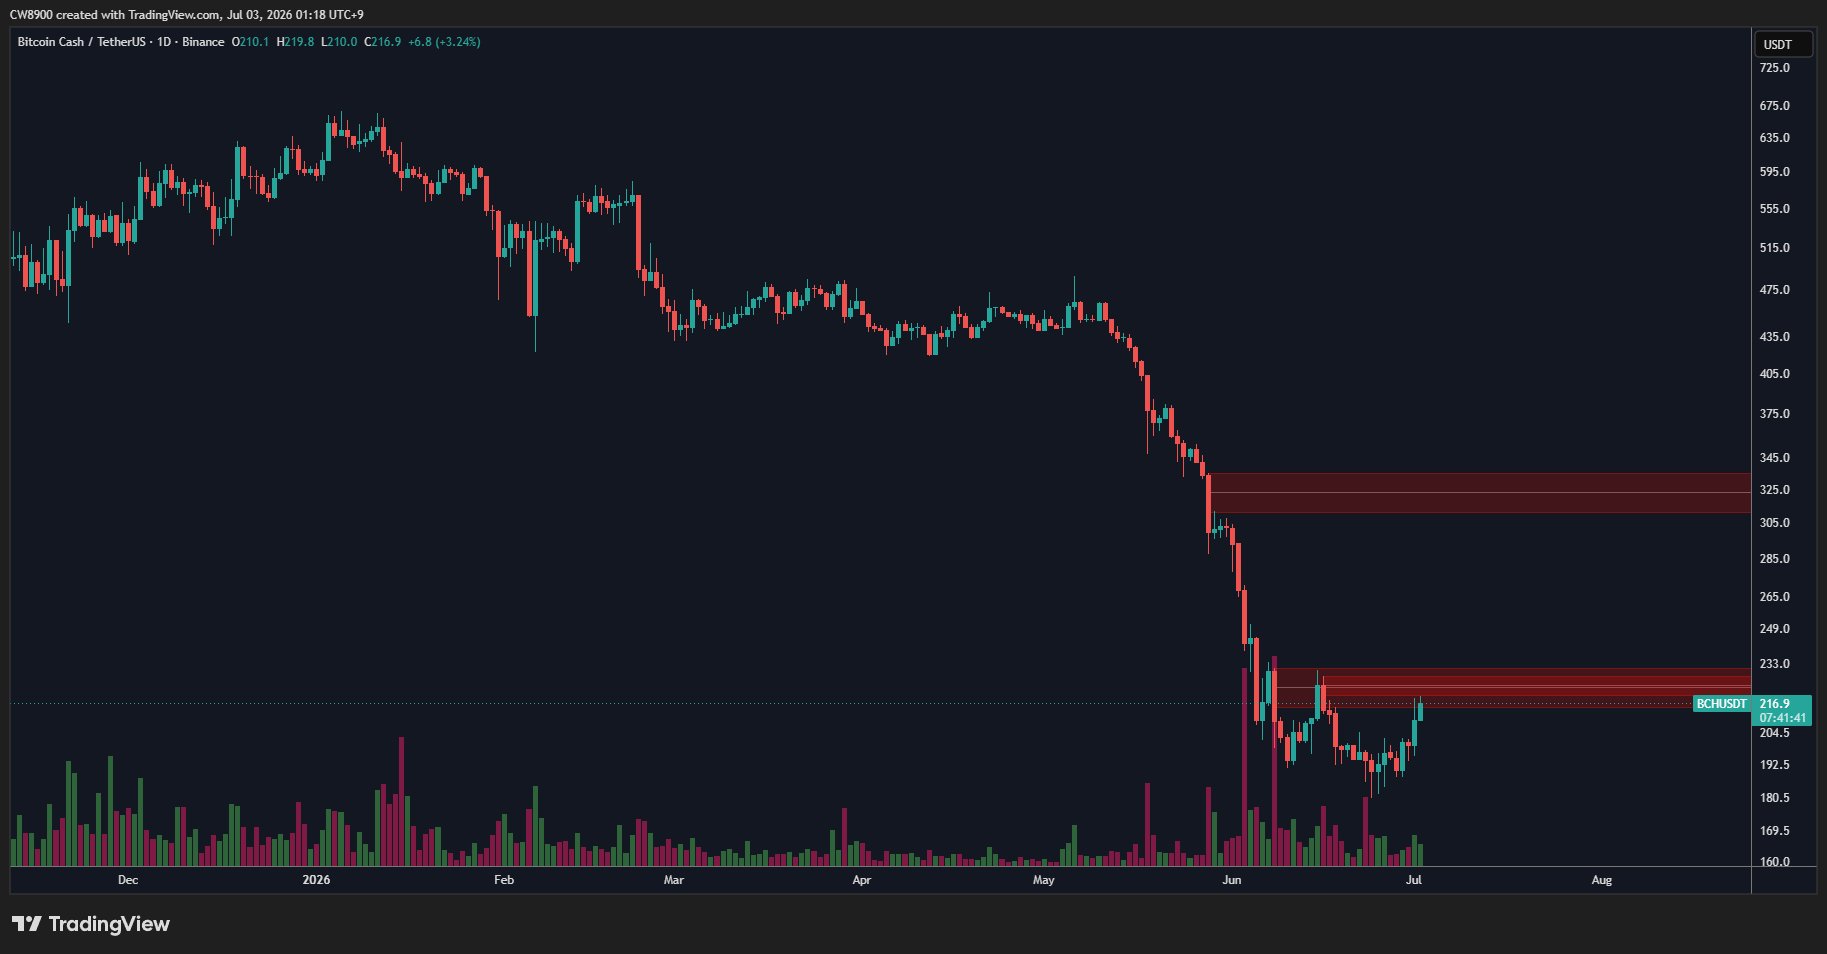 CW OnChain_Analyst Trader B22.77K @CW8900
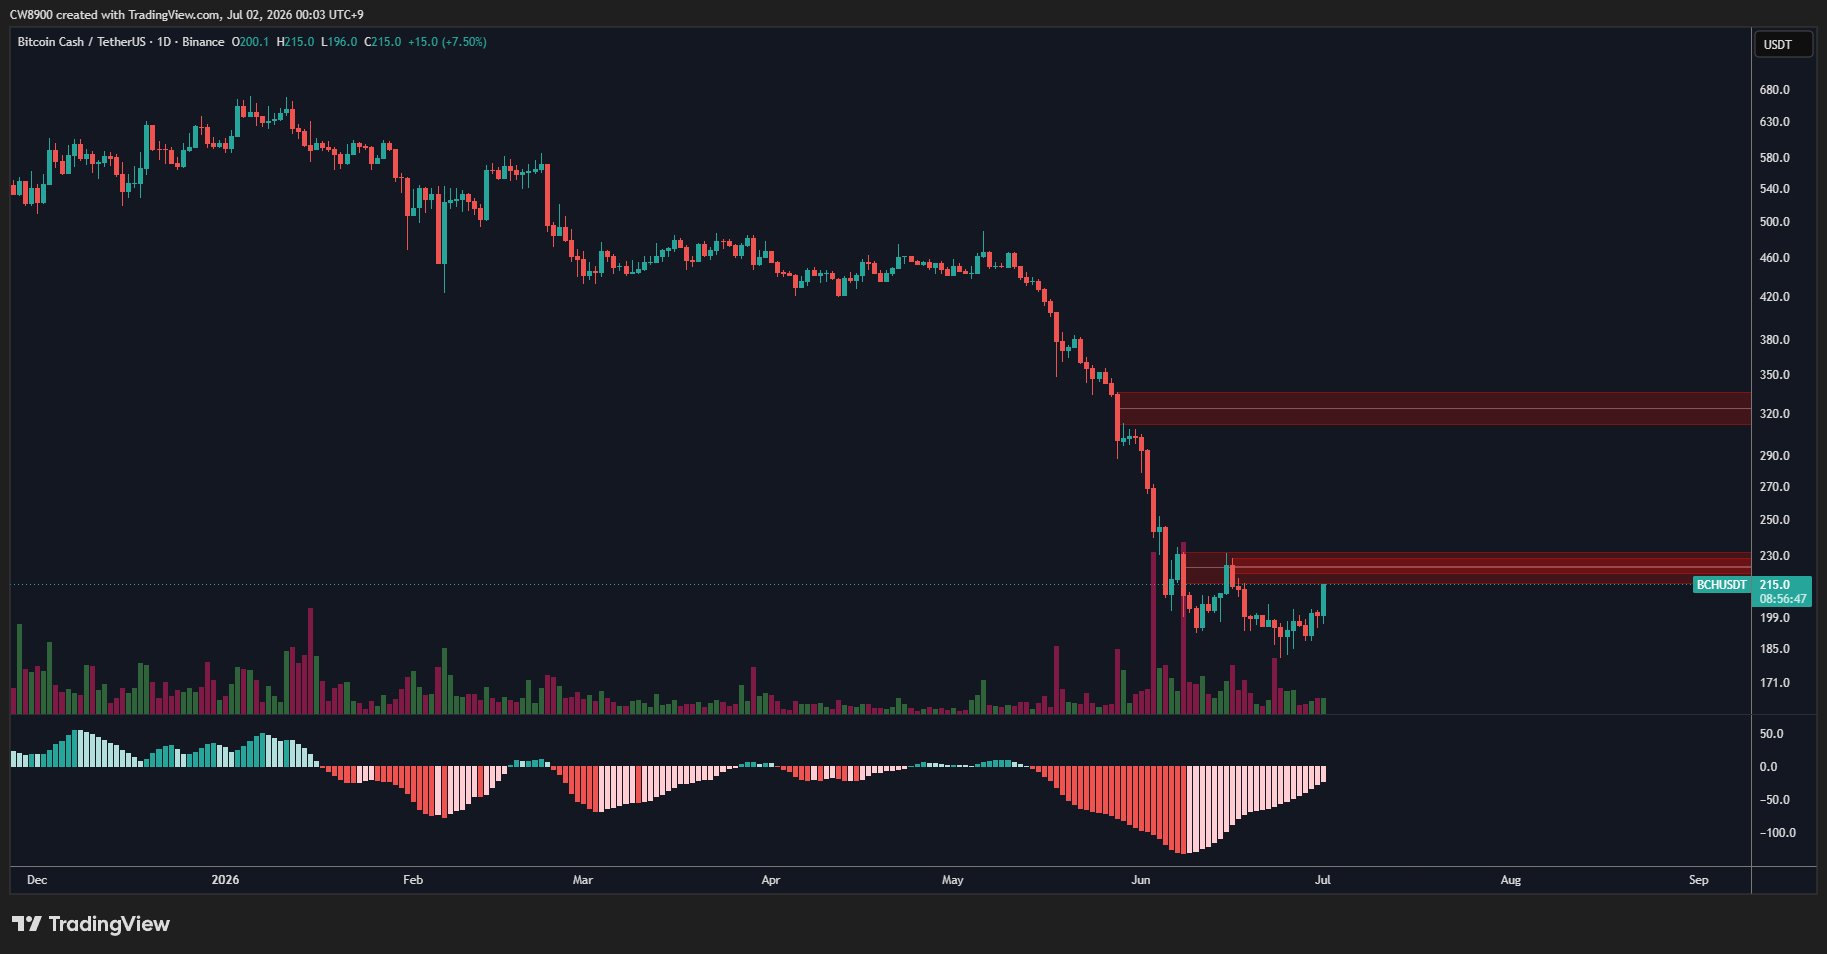 21 5 3.14K 閱讀原文 >釋出後BCH走勢看漲
- 釋出後BCH走勢看跌